Web Monitoring with Prometheus
I've run into the situation where I have had this website go down multiple times without me knowing. I've also had issues with the SSL expiring and not being aware of it. This can lead to some embarassing situations, as I like to put this site and it's contents on my resume.
I prefer to run most services locally within my network. I'm the guy who has a Plex Server and a local file share. So I wanted my monitoring to be local too.
My setup
I have a really nice central home server I use frequently (Samba and Plex mostly). Everything runs within Docker containers. I run all of it off a Raspberry Pi 4 (8GB version). Everything I'm going to setup will be in Docker.
Software Stack
I'll be using Docker, Grafana, Prometheus, and BlackBox Exporter.
- Docker: a containerization engine for Linux
- Grafana: Views metrics in pretty graphs with configurable alerts.
- Prometheus: Collects and stores metrics as a backend for Grafana
- Blackbox Exporter: Metric exporter for Prometheus
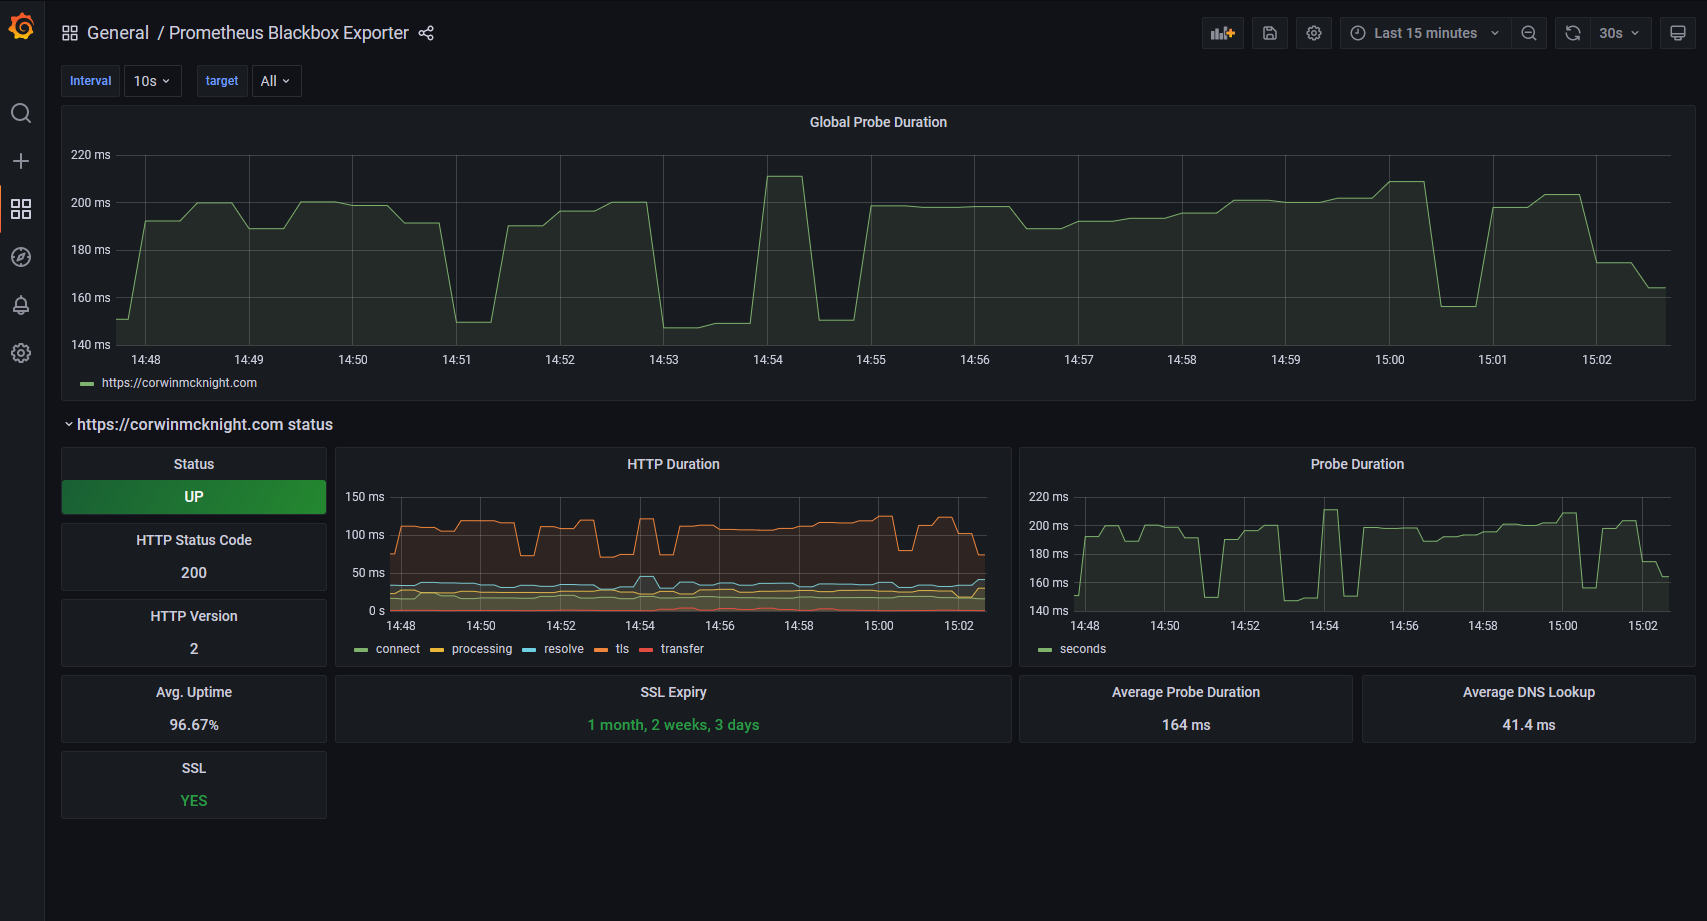
Blackbox exporter will take the roll of Pingdom, every interval we will ping the site and check if it's up, and collect a bunch of data. Prometheus exports and collects that data. Grafana then queries Prometheus with the approprate queries and renders a pretty graph.
Initial setup
First, I installed Docker on my Raspberry Pi. I have a smaller SD card, but a large external drive, so I decided to store all docker images on the hard drive.
Simply modify /etc/docker/daemon.json like so if you need to do this too:
{
  "data-root": "/media/external/services/docker"
}
After that, I started crafting a docker-compose.yml file. This makes the setup easier to reproduce. I'll simply copy it here
version: "3.9"
services:
  grafana:
    # image: grafana/grafana-oss:latest
    build:
      context: ./grafana
    container_name: grafana
    ports:
      - "9089:3000"
    volumes:
      - grafana-data:/var/lib/grafana
  prometheus:
    image: prom/prometheus:v2.21.0
    volumes:
      - ./prometheus:/etc/prometheus
      - prometheus-data:/prometheus
    command: --web.enable-lifecycle  --config.file=/etc/prometheus/prometheus.yml
    ports:
     - "9090:9090"
  blackbox_exporter:
    image: prom/blackbox-exporter:master
    container_name: blackbox_exporter
    ports:
      - "9115:9115"
    volumes:
      - ./blackbox:/config
    command: --config.file=/config/blackbox.yml
volumes:
  grafana-data:
    external: true
  prometheus-data:
Any service I want to be apart of this monitoring stack goes here. This uses docker local networking, so I can refer to services by name.
Now, this stack has this file structure.
/some_directory
    blackbox
        blackbox.yml
    docker-compose.yml
    grafana
        Dockerfile
    prometheus
        prometheus.yml
Configuring Grafana
Within the grafana directory, I "made" a simple Dockerfile
grafana/Dockerfile:
FROM grafana/grafana

ENV GF_AUTH_DISABLE_LOGIN_FORM "true"
ENV GF_AUTH_ANONYMOUS_ENABLED "true"
ENV GF_AUTH_ANONYMOUS_ORG_ROLE "Admin"
All this does is disable user authentication. I don't monitor anything sensitive and this is only accessable via my local network, so I believed this was okay. Evaluate your own security and risk taking policy before doing this verbaitim.
Configuring Blackbox
Blackbox is very simple to setup as well. We will be setting up a simple http watcher.
blackbox/blackbox.yml:
modules:
  http_prometheus:
    prober: http
    timeout: 5s
    http:
      valid_http_versions: ["HTTP/1.1", "HTTP/2", "HTTP/2.0"]
      method: GET
      fail_if_ssl: false
      fail_if_not_ssl: true
      tls_config:
        insecure_skip_verify: true
      basic_auth:
        username: "username"
        password: "password"
Configuring Prometheus
Prometheus did not require much configuration. Be sure to set the website URL here.
prometheus/prometheus.yml:
global:
  scrape_interval: 30s
  scrape_timeout: 10s

rule_files:
  - alert.yml

scrape_configs:
  - job_name: services
    metrics_path: /metrics
    static_configs:
      - targets:
          - 'prometheus:9090'
  - job_name: 'blackbox'
    metrics_path: /probe
    params:
      module: [http_prometheus]
    static_configs:
      - targets:
        - !!!website_url_here!!!
    relabel_configs:
      - source_labels: [__address__]
        target_label: __param_target
      - source_labels: [__param_target]
        target_label: instance
      - target_label: __address__
        replacement:  # The blackbox exporter's real hostname:port.
Final setup
At this point, a simple docker-compose up -d brings up the whole interface. Entering Grafana from [server ip]:9089 , you'll be brought to the home interface. Just add the Prometheus datasource, and then import the dashboard id 7587 and you'll have monitoring!
